How it works
A dashboard shows you numbers and leaves the finding to you. This reads Walmart's own replenishment outputs every morning, finds what is quietly costing you sales, names the one setting that fixes it, and then checks whether the fix worked. In Walmart's language, because that is the language your buyer and your broker speak.
The daily cycle
OVERNIGHT
Your Scintilla exports route into a warehouse we keep for you: daily and weekly, store and distribution center, every item you sell at Walmart. History is kept, so last week is never overwritten by this week.
BEFORE 7AM
Each detector looks for one specific way money leaks: a store that quietly stopped ordering, a DC holding cases while its stores sit empty, a new item granted hundreds of stores that never started flowing, a forecast keyed at half the proven demand.
YOUR MORNING
Ranked by dollars at stake. Every line names the owner, the single Walmart setting to change, and the ask to send, with the store list attached so it can be forwarded without rebuilding the case.
AFTER
A watcher checks whether the store actually started selling again, and banks only the dollars that followed the ask. Watched is not claimed.
The readiness ladder
Most stranded sales are not a demand problem. They are a setup problem, one rung down from where everyone is looking. The platform finds the lowest broken rung and routes the fix to the person who owns that rung.
Highlighted: the rung that was broken in Case Study 2, when Walmart expanded an item from 232 stores to 997 overnight and only 238 sold.
Two kinds of fix
When stores are empty and the DC has cases, the fastest move is to push. The platform builds the push script per DC: fair-share on Walmart's own forecast, capped at order-up-to so no store lands over its ceiling, one row per reachable store, ready to send.
The reason the DC piled up is that GRS never auto-ordered. Fix the trait, load the forecast, get the item valid, and Walmart's system starts doing the work on its own. Every ask on the platform names which of these it is, so the bandaid never gets mistaken for the fix.
Forecast-variance recommendations, supplemental orders, lead-time and minimum-order audits, traited-and-valid follow-up. The platform routes the RM to the levers they can actually pull. It does not try to rebuild Walmart's replenishment engine.
What the detectors look for
These are the families running in live client cockpits today. Each fires only when demand is stranded, never on a rollback or a de-trait that Walmart intended.
Distribution
Traited stores with no replenishment trait, so Walmart builds no forecast and the DC never auto-orders. The ask names the exact trait.
Distribution
Traited and valid, but no forecast loaded. GRS has nothing to order to. Zero-dollar weeks on a store Walmart already granted.
Supply chain
The DC holds cases while every traited store it serves sits at zero. Product is in the building and not on the shelf.
Supply chain
Stores are traited and valid, the DC is at zero on hand and zero on order, and nothing has ever been ordered. Have the DC place the order.
Supply chain
Effective days of supply under five with no replenishment response. Order-up-to and lost-sales math attached.
Launch
A pack or size change issues new item numbers and the old item's proven demand does not follow. The successor is keyed low, stocked low, sells low, and the low sales confirm the low forecast.
Distribution
Stores that used to buy the item and quietly stopped: a de-trait, a reset, a forgotten rollback. Valued at the store's own trailing rate, gated on recency.
Price
Rollbacks and increases measured the same way: units per selling store per week, and the retailer's own margin dollars per store, every settled week at each price.
Detector families as deployed 2026-08. Names are ours; the settings they route to are Walmart's.
Built on Scintilla
DSIDaily store inventory and movementWSIWeekly store inventory, four-week and 52-weekDDCIDaily distribution center inventory, on hand and on orderWDCIWeekly distribution center inventoryDimsItem, store, store-DC alignment, traits, modular, forecastPOsOpen purchase orders and MABD, from Walmart's order systemWeekly and daily cadences both supported. Every number on a screen reconciles back to the source file it came from.
What you get
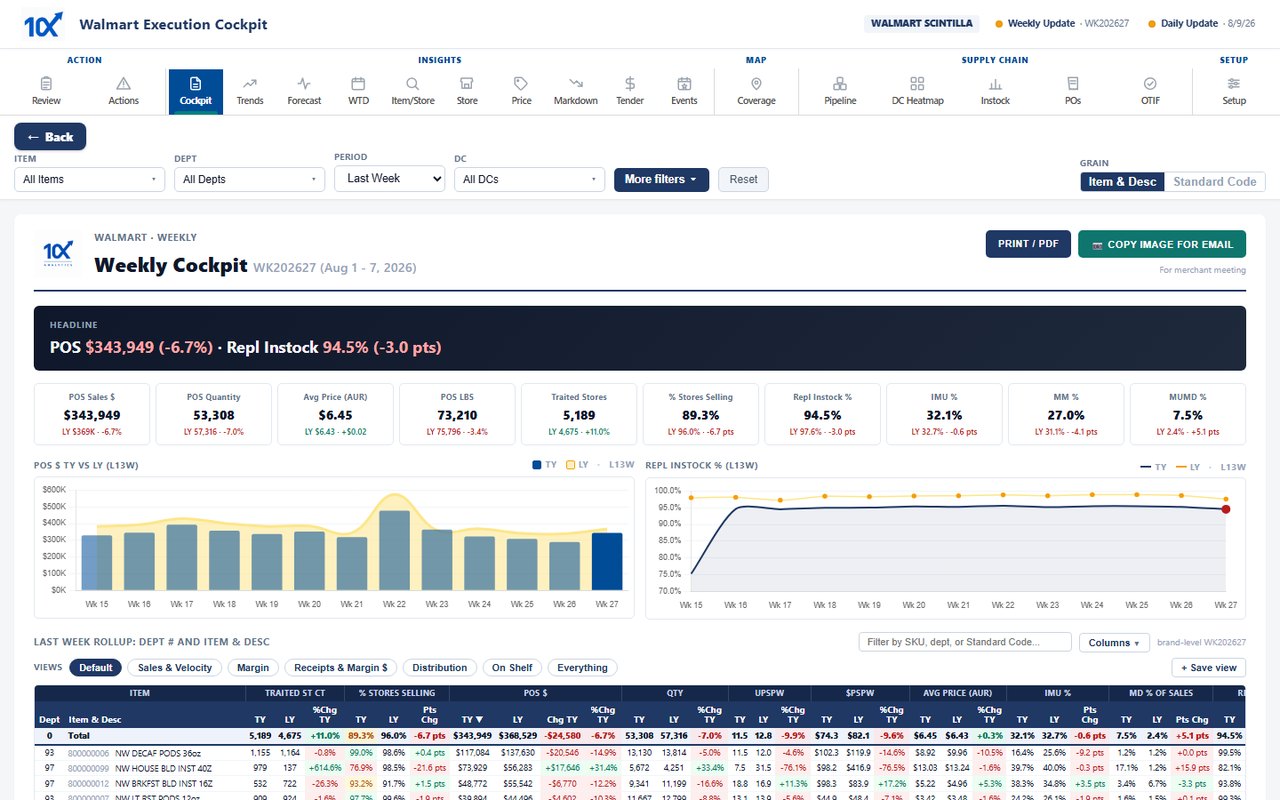
Review: the week's verdict and the top moves. Actions: the ranked queue with owner and ask. Pipeline: every item at every DC, store to shelf, with cases due and readiness. Forecast: where Walmart's forecast and your demand disagree. Instock, POs, OTIF, Price, Markdown, Tender, Trends: each one click deep, no re-aggregation, every number traceable.
Exports are built in: the push script as a workbook Walmart's team can act on, the DC-outs list, the store-level facts pack for a line-review conversation.
Nothing to install. It runs in a browser behind a one-time-code login, on infrastructure we manage. You keep pulling your Scintilla reports; the platform does everything after that.
Start here
Thirty minutes on a call, your data on the screen. If there is nothing there worth fixing, I will tell you that.
ericfritts@tenxanalytics.comEric Fritts · Founder · 479-713-0714 · Rogers, Arkansas